House-Rich, Cash-Poor: The Worst and Best Cities in America Ranked
Over several decades, home prices in the USA have risen rapidly, more than doubling between 2000 and 2020. Incomes, however, have grown at a snail’s pace of just 0.3% per year. It’s no wonder so many people are using our tips and free moving cost calculator.
A result of these two trends is an increasingly common phenomenon dubbed House-Rich, Cash-Poor (HRCP), a category to which as many as 1 in 5 homeowners belong.
For families that are house-rich but cash-poor, an outsized proportion (over 80%) of their net worth lies in their home, and more than 40% of their income is dedicated to living expenses.
Realtors and financial advisors alike generally warn against entering into an HRCP financial situation. When home equity makes up the majority of your net worth, unexpected expenses and financial emergencies can quickly spiral into major issues. Living house-rich, cash-poor can impede homeowners from reaching other financial goals, such as saving for retirement, making home repairs, or saving for their children’s educations.
Beyond hampering the financial goals of individual families, an abundance of HRCP living situations can also have negative ripple effects in the surrounding community. These include rising homelessness, negative health outcomes, and declining cognitive performance in children.
We wanted to see which American cities are home to the worst conditions for a house-rich, cash-poor living scenario. Our data analyst analyzed over 25,000 cities and we adjusted for the population to pull out the 785 most populous cities in the USA according to the median home price, median household income, state tax burden, and statewide price parities to determine where homeownership can cause the most financial hardship.
Get the most up-to-date info for the best interstate movers and best moving container companies to make your move simple.
Findings at a glance
- California is the most house-rich, cash-poor state in the nation. 24 of the top 30 most cash-poor cities are located in California. Of the 177 Californian cities analyzed, 62 ranked within the bottom 10th percentile overall.
- Michigan is the least house-rich, cash-poor state in the nation. 7 of the top 30 least cash-poor cities are located in Michigan. Of the 25 Michigan cities analyzed, 12 ranked within the 90th percentile overall.
- The average population of the nation’s top 30 most house-rich, cash-poor cities is more than five times the average population of the nation’s 30 least house-rich, cash-poor cities (549,805 vs 109,140).
- Higher populations do not necessarily correlate with more house-rich, cash-poor residents. 13 of America’s 30 most populous cities rank within the 50th percentile for a healthy asset-to-liquid ratio.
How we measured House-Rich, Cash-Poor
Our analysis of America’s worst (and best) house-rich, cash-poor cities was limited to cities with a 2019 population estimate from the U.S. Census Bureau exceeding 46,000 residents. This was 785 cities in total.
We calculated a house-to-income ratio for each city by calculating:
- The median household income in the city
- The median home value in the city
- The state tax burden
- Statewide purchasing power parity
The house-to-income ratios range between 1.37 to 14.16. Higher ratios indicate the region has a higher prevalence of house-rich, cash-poor (HRCP) factors (homeownership represents a very high proportion of expenses). Lower scores indicate the region has a lower prevalence of HRCP factors (homeownership represents a smaller proportion of expenses).
Cities were ranked according to the HRCP score, and a percentile was calculated. A city in the 78th percentile for HRCP means that this city has a housing market with conditions more affordable than in 78% of all cities analyzed, while 23% of cities offer better conditions
The Worst: Most house-rich, cash-poor American cities
A rule-of-thumb and bit of financial wisdom often told to first-time homeowners is that a house should cost roughly 2.6 times your annual salary. But in one of America’s 30 most HRCP-prone cities, the median house will cost you an average of 10.46 year’s worth of income – that is, if you don’t spend money on (literally) anything else.
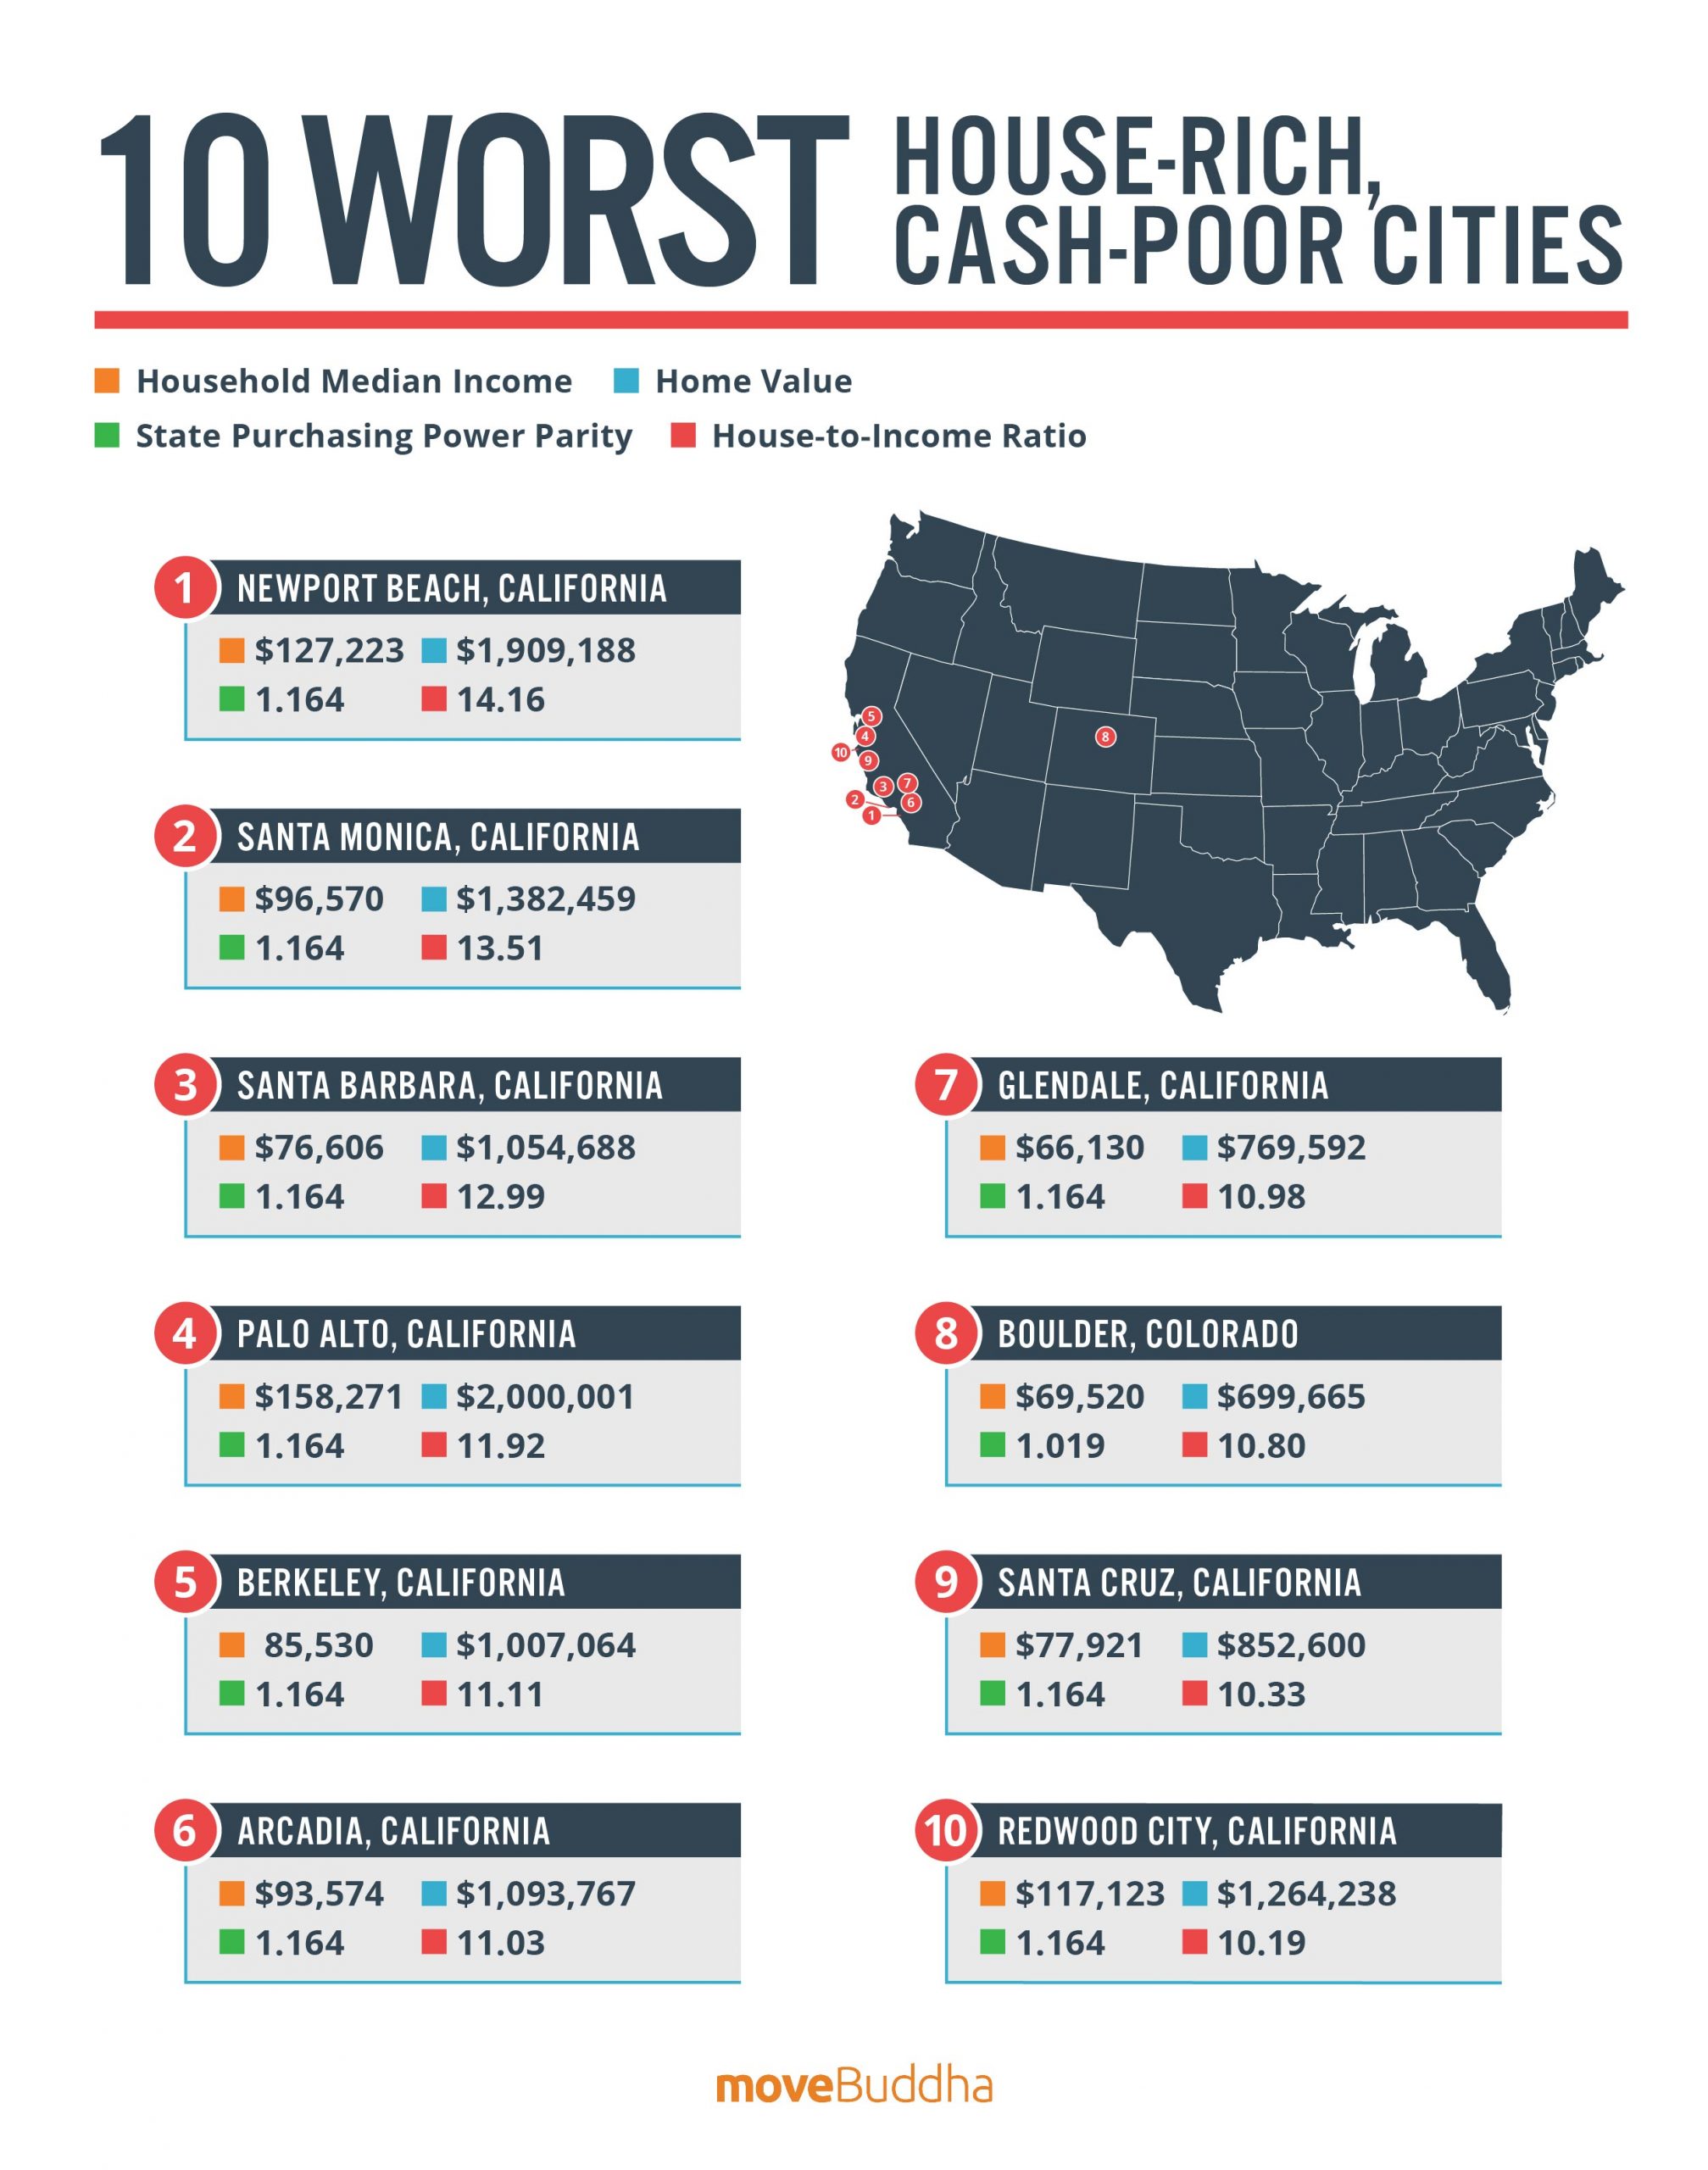
California dominates our list of America’s most house-rich, cash-poor cities: 24 of the top 30 most HRCP cities are located in California. Among all 785 U.S. cities analyzed, Californian cities feature in an outsized proportion of those with the most impossible housing markets. 35% (62 of 177) of the California cities we analyzed ranked among the bottom 10th percentile nationwide.
With a number of California cities in which the median home costs over a million dollars, even the high salaries of Silicon Valley cannot keep up with the cost of putting down roots in the Golden State.
But California isn’t the only place where residents are struggling with an impossible housing market. The term “affordable housing crisis” has been used to describe living situations from Boulder, CO, to Honolulu, HI, to New York, NY, to Miami, FL.
The Best: Are these the most approachable real estate markets in America?
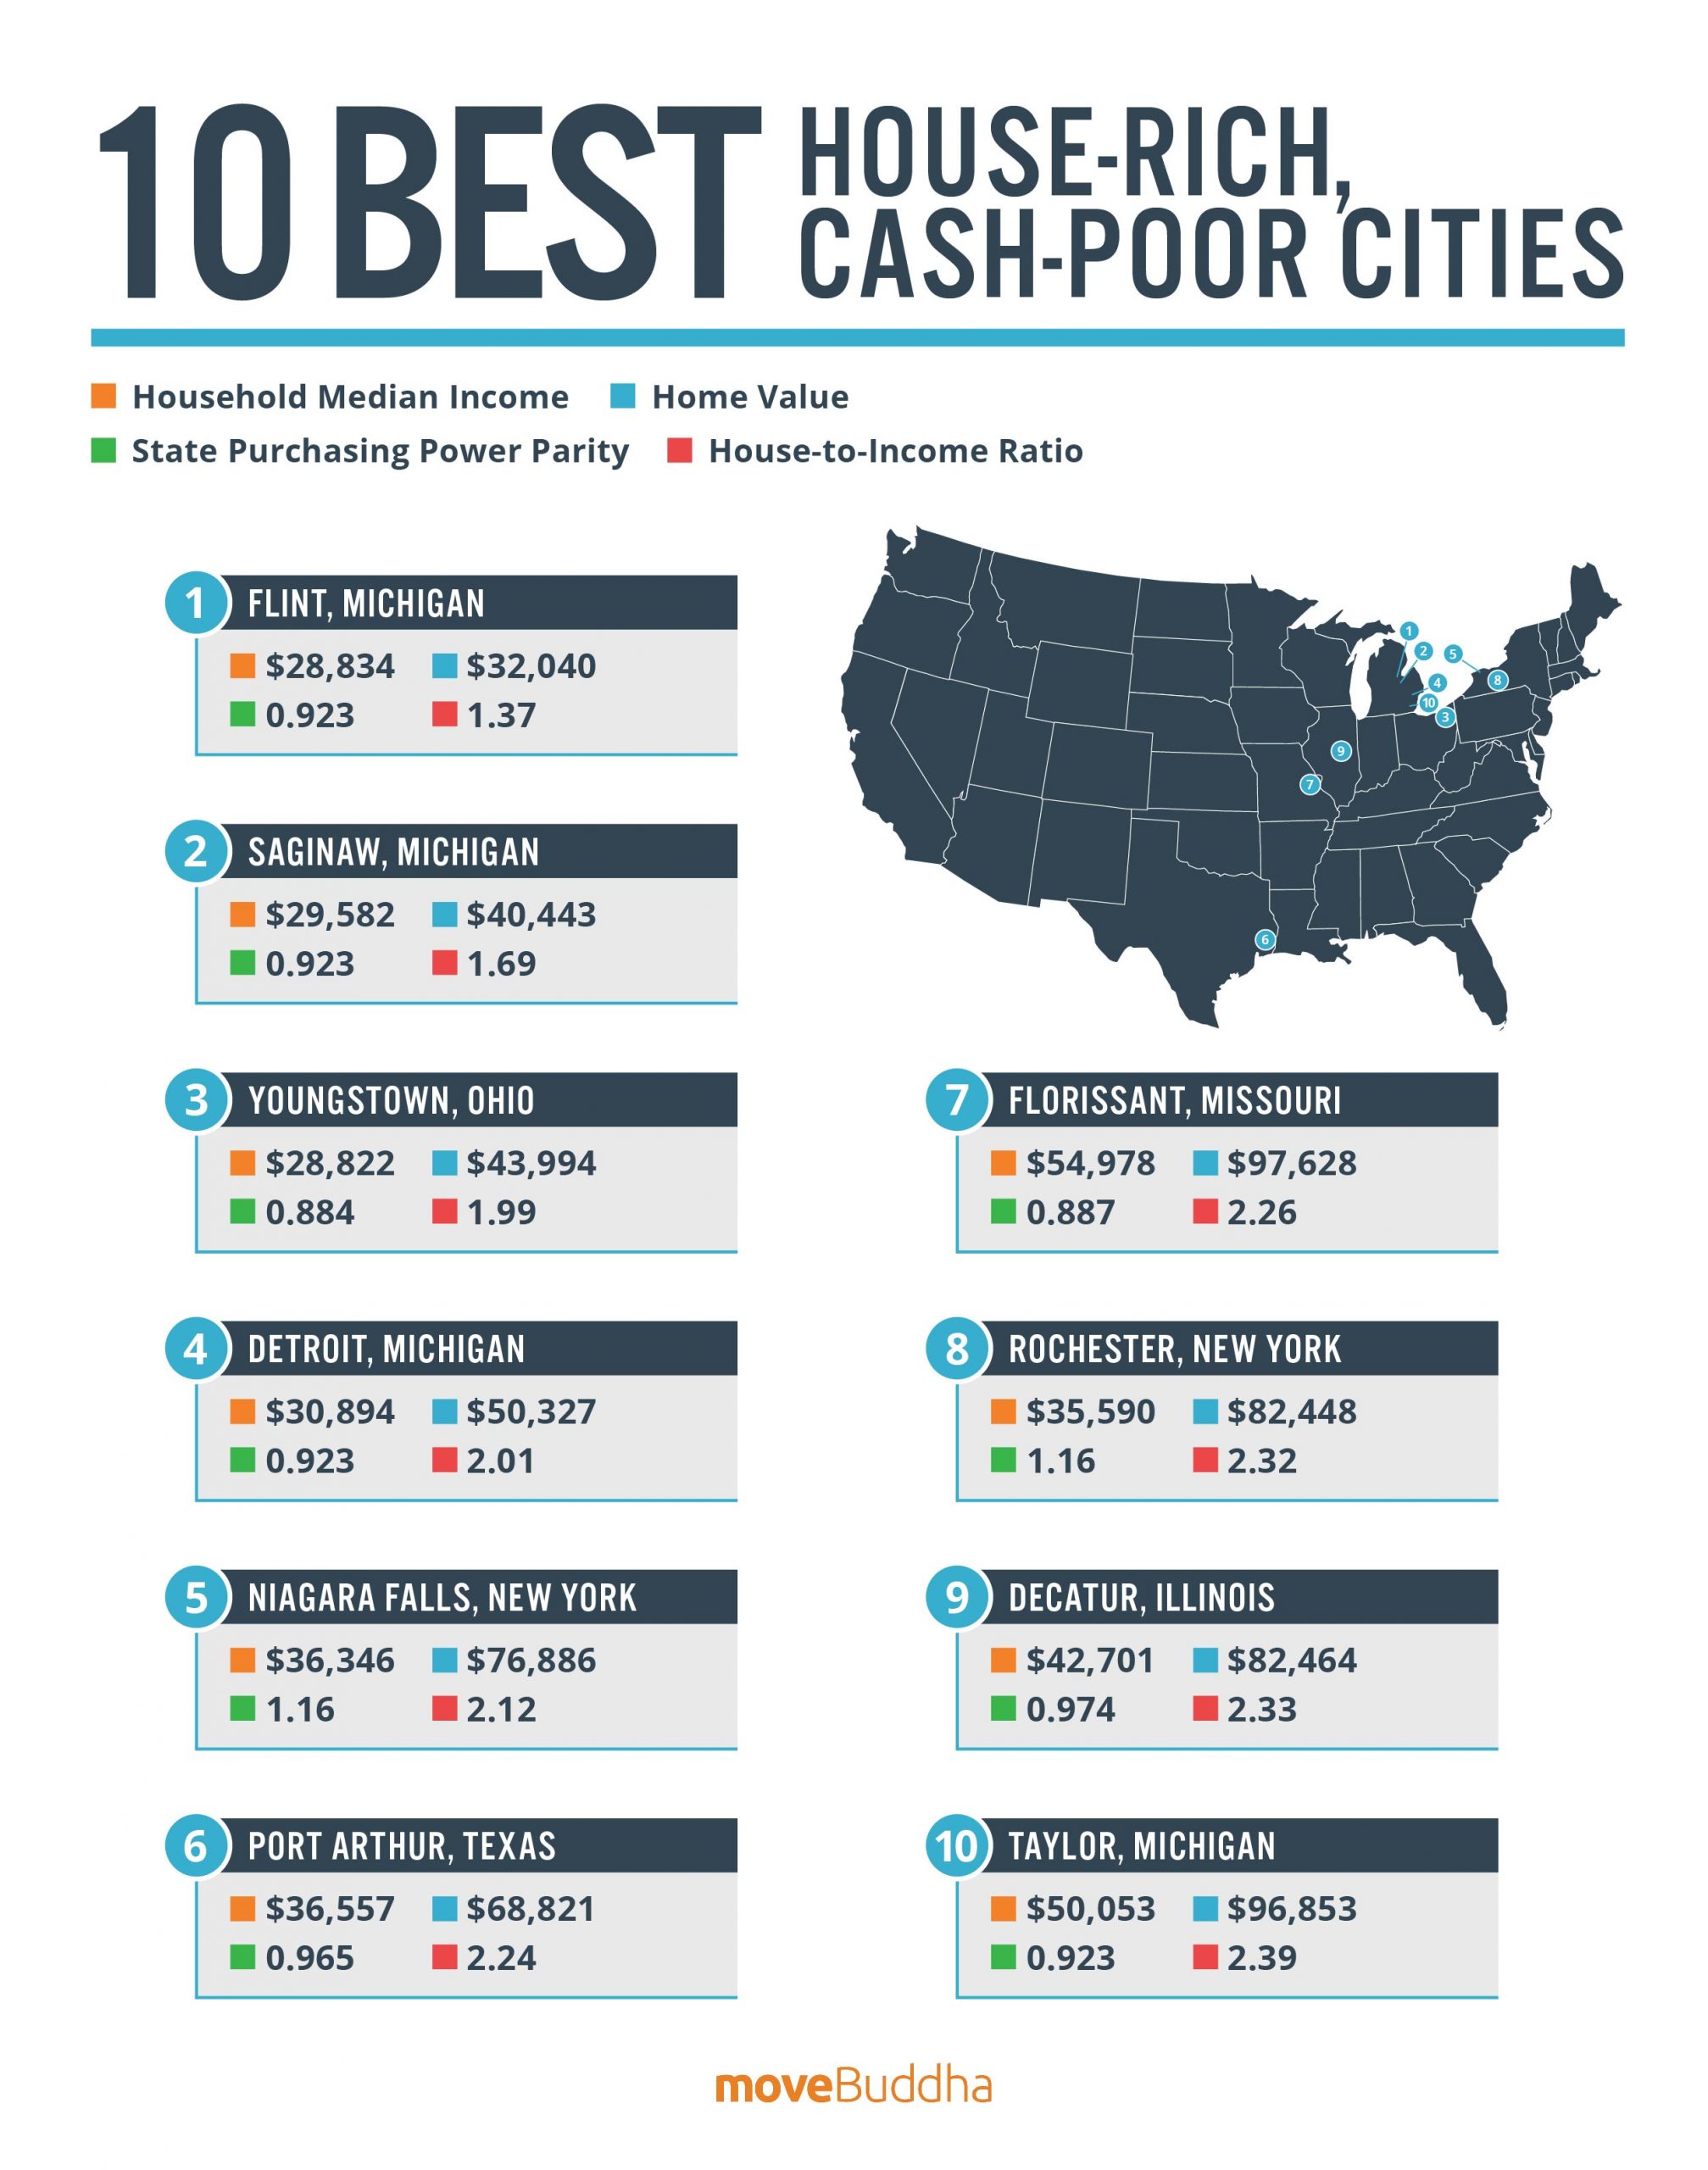
While coastal cities seem to be plagued by an epidemic of HRCP, many midsize cities in the Midwest and Texas continue to offer affordable housing markets with a median income to home value ratio at or below the fabled sweet spot of 2.6.
Michigan is the anti-California when it comes to home value and wealth. Seven Michigan cities appear in America’s top 30 least house-rich, cash-poor markets. And of the 25 Michigan cities we analyzed in this study, twelve fell within the top 90th percentile nationwide.
Beyond just Michigan, the broader American Midwest may be the most affordable region in the country for homeowners. Our top 30 features six cities in western New York state, four cities in Ohio, three in Indiana, and two in Illinois.
Texas also features heavily among the 30 least HRCP cities, with six placements in total. With a comparatively low state tax burden and higher median household incomes compared to midwestern states, a number of midsize cities in Texas offer ideal affordability conditions for homeowners.
Though these cities may be especially accessible to first-time homeowners, affordable housing does not always correlate with an excellent quality of life. In fact, a surplus of affordable homes may in some cases suggest greater problems that are deterring people from living there.
For instance, the top-ranked city, Flint, MI, has gained notoriety for its five-year-long water crisis that exposed between 6,000 and 12,000 children to lead. In another example, the entire city of Port Arthur, TX was submerged by water during Hurricane Harvey in 2018. And despite steady decreases in the rates of violent and property crime in recent years, Trenton, NJ continues to rank among America’s most dangerous cities.
Are larger cities more likely to be house-rich, cash-poor?
One might assume the country’s largest cities would generally be more likely to give rise to HRCP conditions. After all, shouldn’t more people vying for homes contribute to competition that leads housing prices to rise?
While this line of thinking is true in some cases, it is hardly generalizable. The top 30 most populous cities in America have housing markets that run the gamut from prohibitively expensive (New York, Los Angeles, San Francisco), to get-in-now-while-you-still-can (Austin, Denver, Charlotte), to super-affordable (Detroit, Memphis, San Antonio).
The data shows that the American dream of homeownership in a big city can still be affordable, as long as you opt for the likes of Nashville over New York, or Louisville over Los Angeles.
It is however true that the most house-rich, cash-poor cities are, on the whole, much more populous than the least HRCP cities. The average population of the top 30 most HRCP cities is 549,805 – this is more than five times that of the nation’s 30 least HRCP cities, whose average population is 109,140.
Methodology
The relationship between median household income and median home value is an oft-cited metric used to understand the housing market in any given city. Comparing just these two metrics, however, does not take into account the cost of living in a region. In our study, we additionally synthesized data about state tax burdens and state purchasing power with median household income and median home value. We believe this gives us a more accurate picture of homeowners’ chances to build liquid assets in any given region.
Data sources
- Median household income by city – Census American Community Survey
- Median home value by city – Census American Community Survey
- State tax burden (percent of income) – Wallet Hub 2021
- Statewide regional price parities (relative value of $1) – Bureau of Economic Analysis 2019
- Population by city – Census Bureau 2019 estimates
HRCP score formula
In order to take taxation rates and regional cost of living into account, we subtracted from the household median income the percentage that would be dedicated to state tax burden. The difference represents the total take-home pay of a household after taxes. We then multiplied this figure by the real value of $1 in that state, thus arriving at an adjusted median income that reflects not only take-home pay but also the cost of living in an area.
An HRCP score for each city was calculated by dividing the median home value by this adjusted median income.
Not what you were looking for?
Check out other categories that can help you find the information you need!

